<Result Analysis> Strong performance amid commodities price and geopolitical volatility
- Wilmar’s 1H22 core net profit reached US$1.16bn (+58% y-o-y), above our estimate
- Successfully navigated commodities price and geopolitical volatility
- Maintain BUY with TP of S$6.67
What’s new
- 1H22’s core net profit reached US$1.16bn (+58% y-o-y), above our and consensus forecast. Wilmar’s 2Q22 net profit expanded by 31.4% q-o-q to US$652m (+111% y-o-y) as it successfully raised prices in food products division without losing sales volume. Wilmar also navigates the commodities price volatility very well. 1H22 earnings accounted for 61% of our FY22 core net profit forecast of US$1.9bn (+2.3% y-o-y). Wilmar will distribute interim dividend of Scts6/share (DPR: 32%).
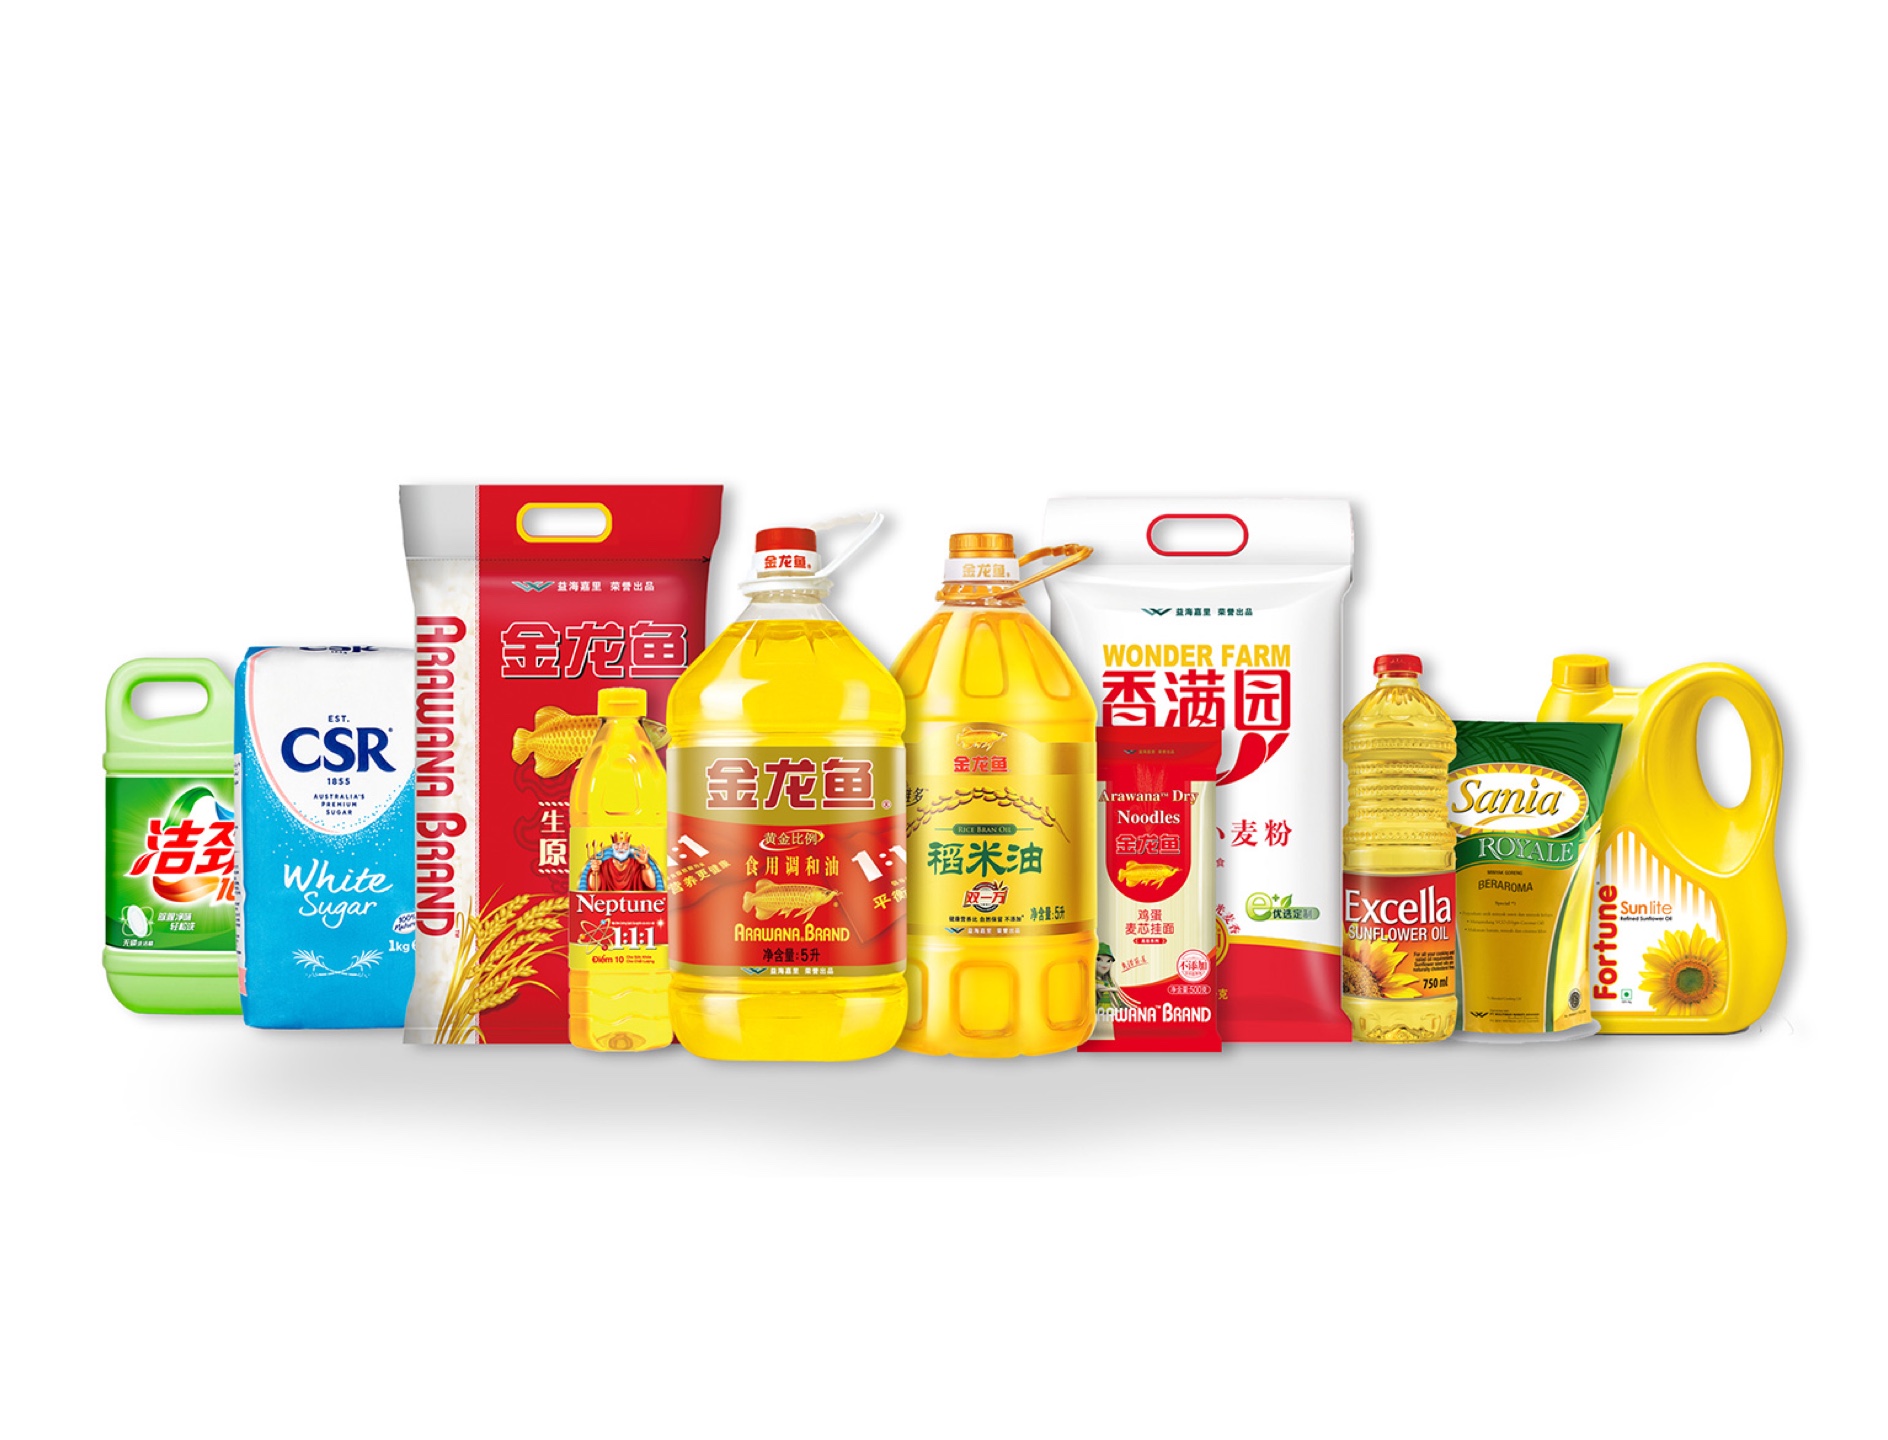
- Food products:Profit before taxes (PBT) climbed by 22% y-o-y to US$520.5m in 1H22. There was a US$175.6m gain on dilution of interest in Adani Wilmar (AWL) in 1Q22. Meanwhile in 2Q22 the Group made upward price adjustments to its consumer products to mitigate the impact of rising commodities price. Sales volume (bulk+ consumer products) grew by 4% y-o-y to 13.8m MT despite COVID-19 resurgence in China.
- Feed & industrial products: Benefited from recovering soybean crushing margins. The segment reported PBT of US$502.7m (+5% y-o-y) in 1H22 on soybean crushing margin recovery and higher crushed soybean volumes. Overall profit was partially impacted by weaker sugar merchandising activities. Meanwhile, tropical oil business was impacted by challenging Indonesia government policies in 2Q22.
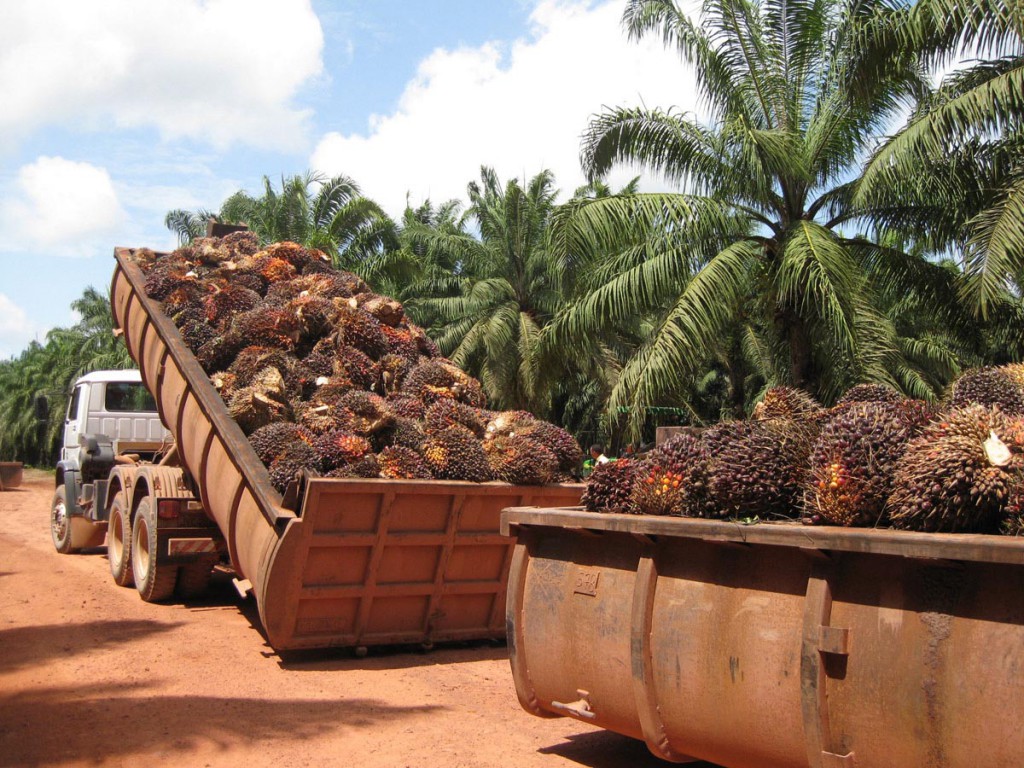
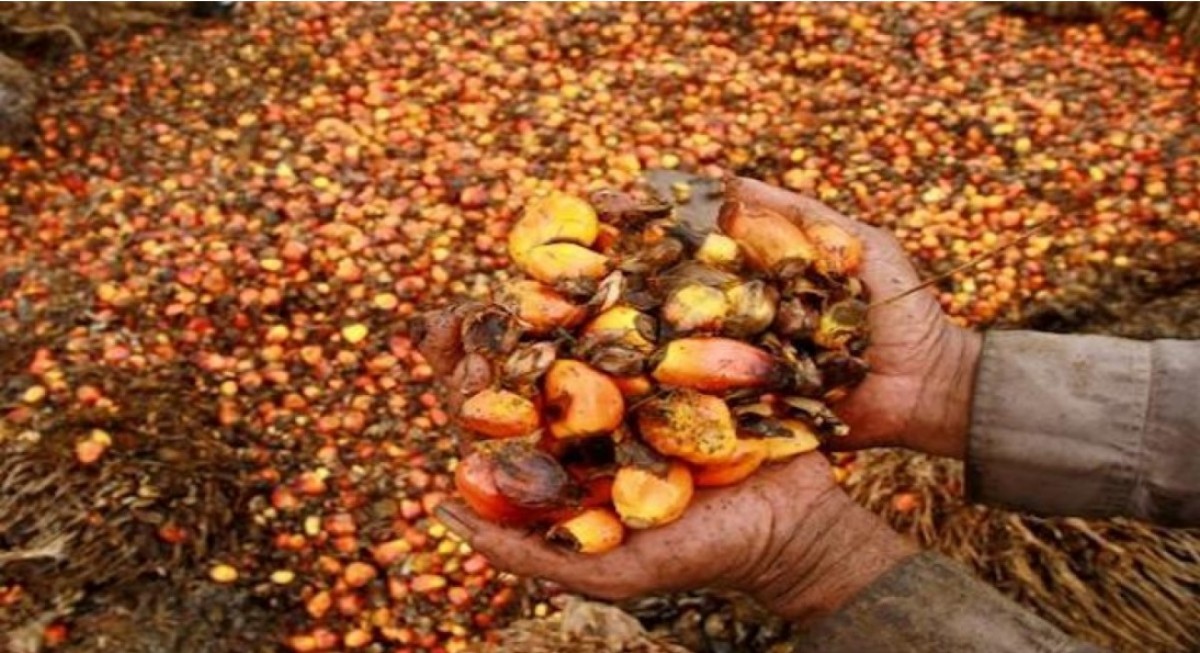
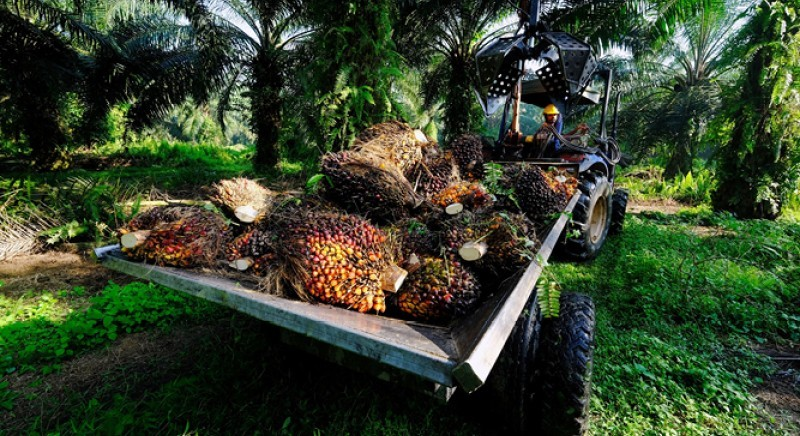
- Plantation & sugar milling: PBT expanded >100% y-o-y to US$453m in 1H22. Profit for the segment more than doubled y-o-y, driven by the higher palm oil price and better performance of the sugar milling operations in India.
- Cash flows and balance sheet. Amid commodities price volatility, Wilmar successfully kept the cash conversion cycle (CCC) at 89 days (1H21: 90 days). Net debt to equity ratio climbed to 0.99x in 1H22 (1H21: 0.89x) on higher working capital requirement.
Our view
- Positive earnings momentum will sustain in 2H22. Wilmar’s integrated and diversified business model and the prudent risk management would enable the group to deliver good earnings amid commodities price , geopolitical volatility, and unusual weather conditions.
- We maintain our BUY rating with TP of S$6.67. Wilmar is trading at FY23 PE of 9.5x, -2 standard deviation of its five years average PE multiple of 11.8x. We think investors have mispriced Wilmar as an upstream plantation company at this share price level, despite Wilmar’s well-integrated business platform that is consistently profitable even amid commodities price volatility.
Quarterly financial summary
| 2Q22 | 1Q22 | 3Q21 | 2Q21 | y-o-y | q-o-q | 1H22 | 1H21 | y-o-y | |
| US$m | US$m | US$m | US$m | change | Change | US$m | US$m | Change | |
| Revenue | 18,558 | 17,576 | 17,135 | 15,271 | 21.5% | 5.6% | 36,134 | 29,534 | 22.3% |
| EBITDA | 1,242 | 1,108 | 1,140 | 797 | 55.9% | 12.2% | 2,350 | 1,884 | 24.7% |
| Net Profit | 635 | 530 | 569 | 301 | 111.0% | 19.7% | 1,165 | 751 | 55.1% |
| Core Net Profit | 652 | 503 | 576 | 308 | 111.4% | 29.5% | 1,155 | 732 | 57.8% |
| EBITDA margin | 6.7% | 6.3% | 6.7% | 5.2% | 6.5% | 6.4% | |||
| Net Profit margin | 3.4% | 3.0% | 3.3% | 2.0% | 3.2% | 2.5% | |||
| Core Net Profit margin | 3.5% | 2.9% | 3.4% | 2.0% | 3.2% | 2.5% | |||
| Sales Statistics (‘000MT) | |||||||||
| Food Products | |||||||||
| Consumer Products | 1,941 | 2,330 | 2,231 | 1,618 | 20.0% | -16.7% | 4,271 | 4,103 | 4.1% |
| Medium Pack and Bulk | 4,979 | 4,575 | 5,237 | 4,719 | 5.5% | 8.8% | 9,554 | 9,213 | 3.7% |
| Feed and Industrial Products | |||||||||
| Tropical Oils | 4,890 | 5,058 | 5,875 | 5,776 | -15.3% | -3.3% | 9,948 | 10,969 | -9.3% |
| Oilseeds and Grains | 5,519 | 4,098 | 4,992 | 4,932 | 11.9% | 34.7% | 9,617 | 9,074 | 6.0% |
| Sugar | 2,491 | 2,718 | 2,714 | 3,700 | -32.7% | -8.4% | 5,209 | 6,133 | -15.1% |
| Operating cashflow before working capital changes | 863 | 654 | 985 | 750 | |||||
| Cashflow from operating activiities | 222 | (496) | 2,064 | (1,489) | |||||
| Net Debt | 19,561 | 18,471 | 15,698 | 16,886 | |||||
| Equity attributable to owners of the Company | 19,805 | 20,303 | 19,265 | 19,013 |
| Segmental PBT (US$m) | 1H2022 | 2H2021 | 1H2021 | 1H22/1H21 | FY2021 | FY2020 | y-o-y |
| Food product | 520.5 | 252.6 | 428.3 | 22% | 681 | 1,152 | -41% |
| Feed and industrial product | 502.7 | 782.2 | 478.8 | 5% | 1,261 | 796 | 58% |
| Plantation and sugar milling | 435.8 | 400.1 | 164 | 166% | 564 | 105 | 438% |
| Others | 2.2 | 38.5 | 8.7 | -75% | 47 | 59 | -20% |
| Joint Ventures & Associates | 153.1 | 80.3 | 139.2 | 10% | 220 | 202 | 9% |
| Unllocated expenses | -2.9 | -3.3 | -3.5 | -17% | (7) | (3) | 100% |
| Profit before taxes | 1,611 | 1,550 | 1,216 | 33% | 2,766 | 2,311 | 20% |
Source : Company, DBS Bank