<Result Analysis> Core earnings reached US$1.8bn (+24% y-o-y) in 2021 , beating our expectations
- 2021’s core earnings reached US$1.8bn (+24% y-o-y), beating our estimates
- Vegetable oil refining division was the strongest performer last year
- Maintain BUY rating with TP of S$6.67
What’s new
- Core earnings reached US$534m (+53% y-o-y, -7.4% q-o-q) in 4Q21 , beating our estimates and consensus. Wilmar’s FY21 core earnings reached US$1.8bn (+24% y-o-y), 117% of our FY21 earnings forecast of US$1.56bn (+3% y-o-y).
- FY21 total dividend reached S$0.155/share (39% payout ratio). Wilmar proposed final dividend of S$0.105/share on top of its interim dividend of S$0.05/share paid in August 2021.
- Revenue and Profit Before Taxes (PBT) grew by 30% y-o-y and 20% y-o-y to US$65.8bn and US$2.8bn respectively. The strong performance was driven by Feed & Industrial Products , as well as Plantation & Sugar milling division, meanwhile the Food Products hurt by faster than expected raw material price hike.
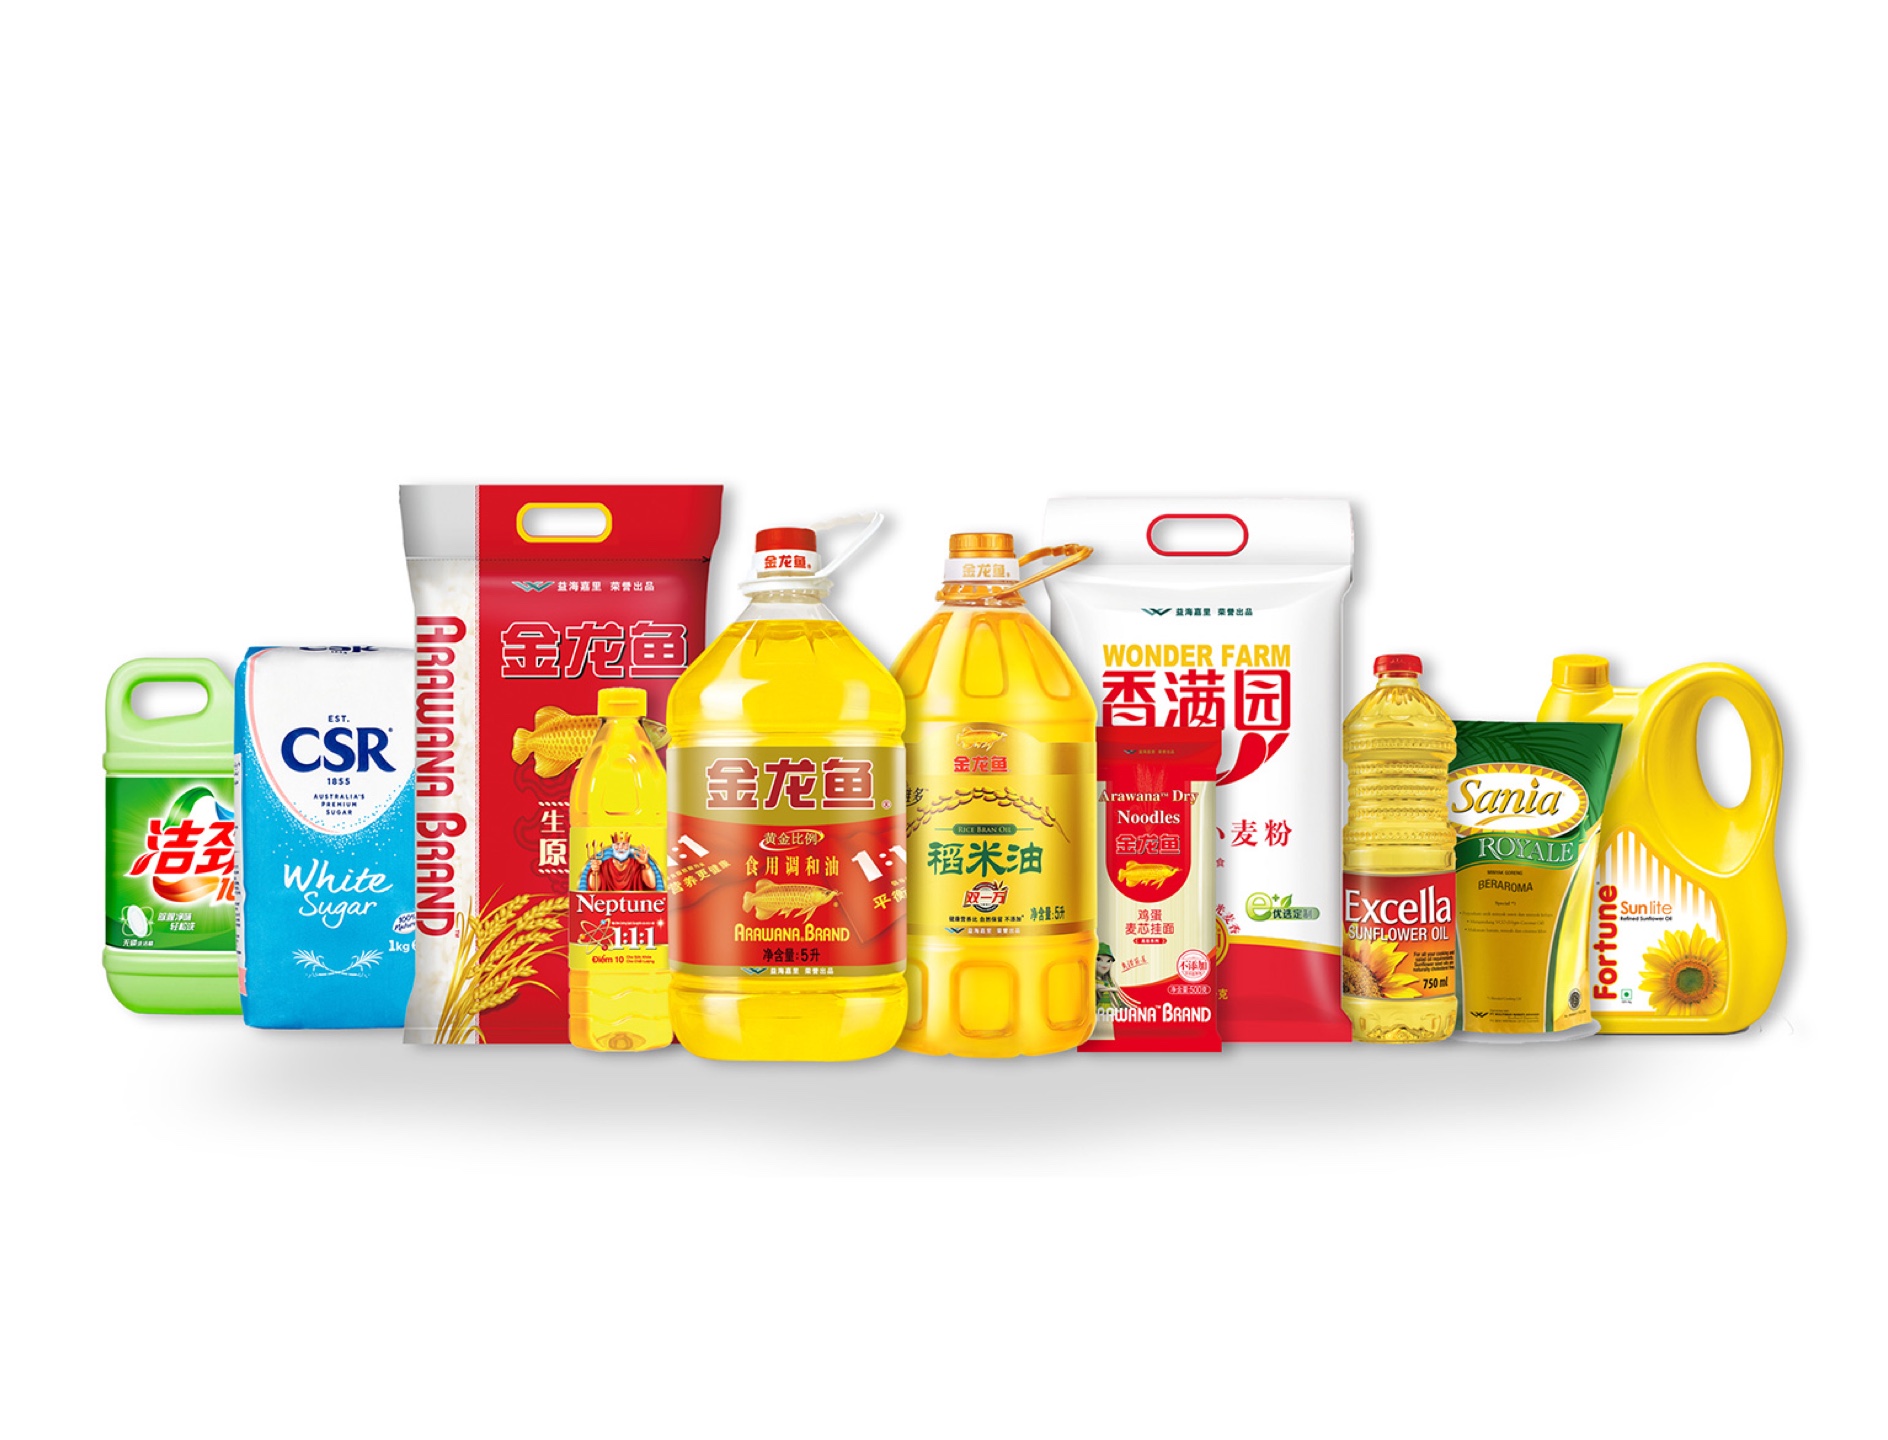
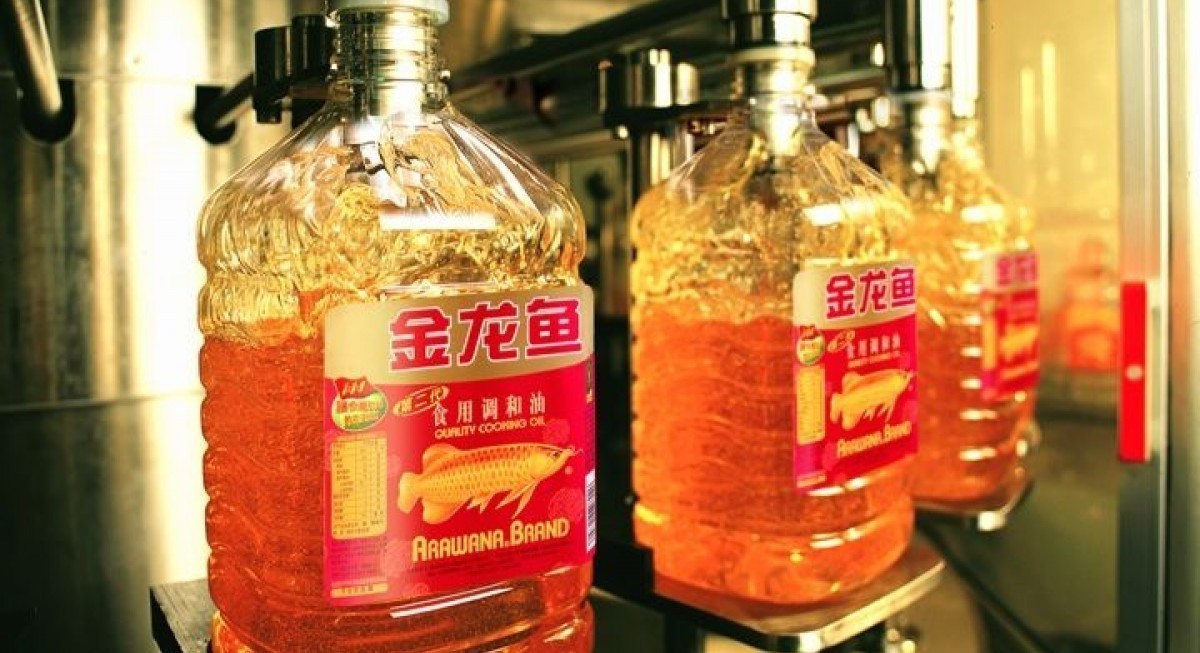
Food products : Hit by higher raw material cost
- Food products revenue grew by 25% y-o-y to US$29.5bn in 2021 with overall sales volume grew by 4% y-o-y to 28.3m MT. Medium Pack and Bulk segment led the growth last year on the back of COVID-19 restrictions relaxation globally. Wilmar saw consumer consumption trend last year already recovered back to pre-COVID level.
- However, despite the higher sales volume Food Products PBT dropped by 41% y-o-y to US$681m in 2021 due to higher raw material cost.
Feed and industrial products : Good refining margin boosted performance . Revenue and PBT grew by 34% y-o-y and 58% y-o-y to US$39bn and US$1.26bn respectively. Good refining margins and sustained demand from midstream tropical oil products , as well as steady contributions from sugar merchandising activities drove the performance amid thin soybean crushing margin especially in 2H21 due to lower soybean meals demand.
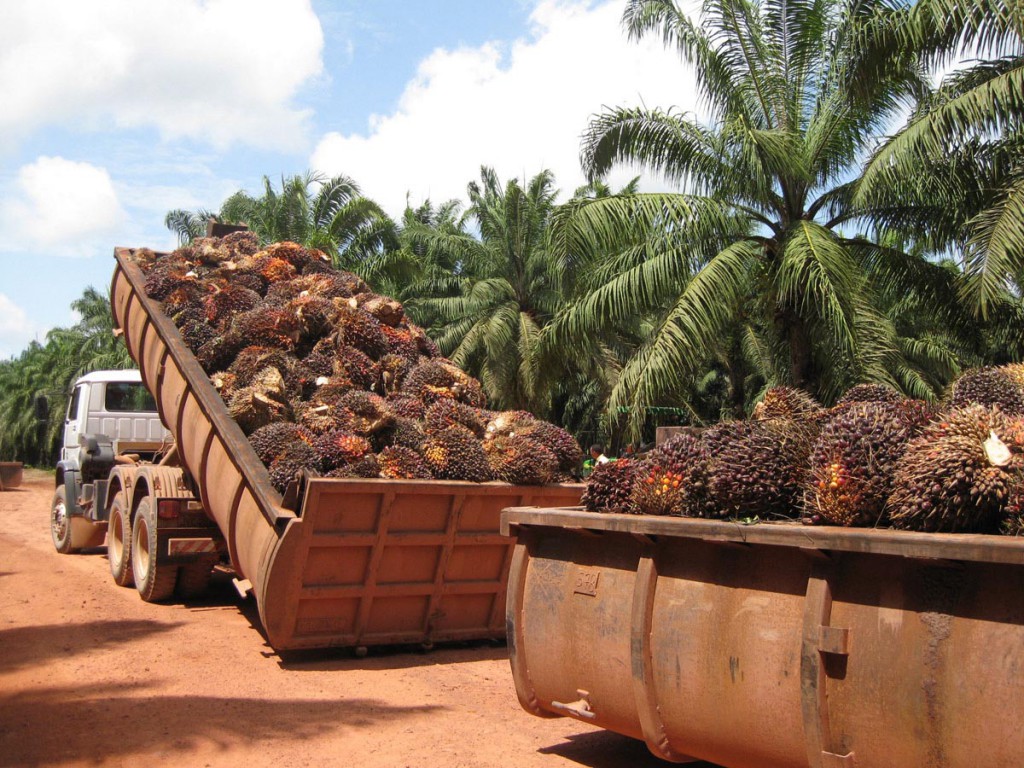
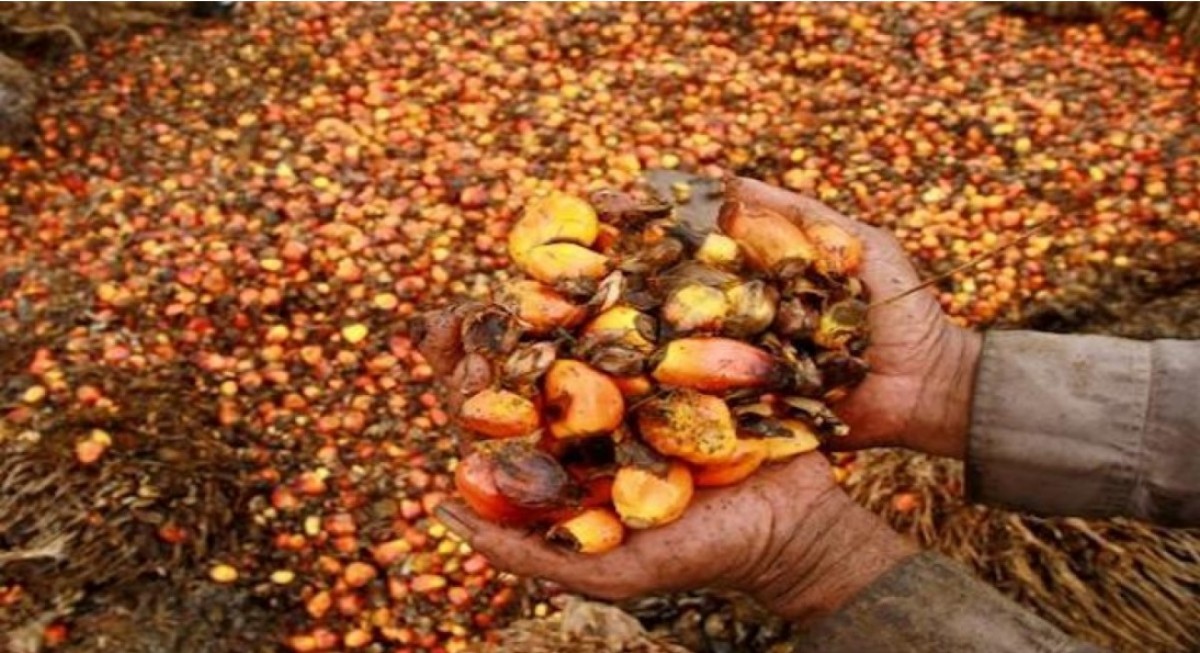
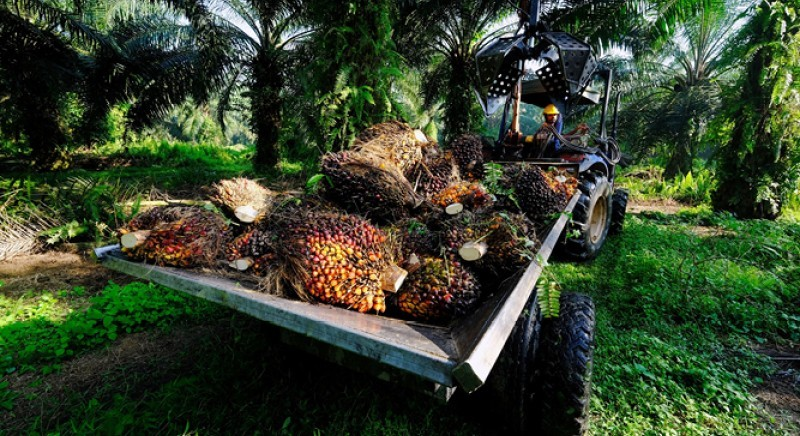
Plantation and sugar milling : Benefited from firm palm oil price trend. PBT more than doubled y-o-y to US$564m (+438% y-o-y) in 2021. Firmer palm oil price was the key earnings driver despite CPO production impacted by unfavorable weather conditions. Fresh Fruits Bunches (FFB) output dropped by 9% y-o-y in 2H21 with lower FFB yield of 9.5 MT/ha vs. 2H20’s 10.8MT/ha.
Balance sheet : ROE improved alongside earnings . Wilmar’s ROE improved alongside its earnings to 9.7% in 2021 vs. 2020’s 8.6%. Net debt/equity climbed to 0.87 in FY21 x vs. last year 0.72x due to higher working capital requirement and capex of US$2.5bn (+20% y-o-y). Wilmar’s cash conversion cycle expanded to 89 days in FY21 vs. last year 81 days.
Our view
- Oil refining will continue to drive earnings performance in 2022. Wilmar highlighted the Palm Processing, Palm Plantation and Sugar milling will perform well this year, meanwhile the performance outlook for soybean crushing will remain challenging due to high soybean prices and poor hog farming margin in China. Food products will grow on new processing plants and central kitchen business expansion.
- We maintained our current FY22 core net profit forecast of US$1.63bn (-12% y-o-y). Despite the stronger than expected 2021 earnings performance, we conservatively prefer to retain our 2022 earnings forecast. We believe our earnings estimate reflected management’s outlook especially the impact of high raw material prices to its seeds and grains crushing operations.
- Reiterate our BUY rating with TP of S$6.67. We like Wilmar on its capability to churn healthy margin and earnings due to its integrated upstream-downstream business platform. Meanwhile Wilmar is only trading at FY22 PE of 12x, which is not too far from CPO plantation companies PE multiple, despite Wilmar’s transition into a consumer goods company.
Quarterly financial summary
| 4Q21 | 3Q21 | 2Q2021 | 1Q2021 | 4Q2020 | y-o-y | q-o-q | FY21 | FY20 | y-o-y | |
| US$m | US$m | US$m | US$m | US$m | change | Change | US$m | US$m | Change | |
| Revenue | 19,125 | 17,135 | 15,271 | 14,263 | 14,551 | 31.4% | 11.6% | 65,794 | 50,527 | 30.2% |
| EBITDA | 1,148 | 1,140 | 797 | 1,087 | 1,032 | 11.2% | 0.8% | 4,172 | 3,609 | 15.6% |
| Net Profit | 570 | 569 | 301 | 450 | 386 | 47.6% | 0.3% | 1,890 | 1,534 | 23.2% |
| Core Net Profit | 534 | 576 | 308 | 424 | 349 | 53.0% | -7.4% | 1,842 | 1,486 | 24.0% |
| EBITDA | 6.0% | 6.7% | 5.2% | 7.6% | 7.1% | 6.3% | 7.1% | |||
| Net Profit | 3.0% | 3.3% | 2.0% | 3.2% | 2.7% | 2.9% | 3.0% | |||
| Core Net Profit | 2.8% | 3.4% | 2.0% | 3.0% | 2.4% | 2.8% | 2.9% | |||
| Sales Statistics (‘000MT) | ||||||||||
| Food Products | ||||||||||
| Consumer Products | 2,205 | 2,231 | 1,618 | 2,485 | 2,243 | -1.7% | -1.2% | 8,539 | 9,423 | -9.4% |
| Medium Pack and Bulk | 5,276 | 5,237 | 4,719 | 4,494 | 5,292 | -0.3% | 0.7% | 19,726 | 17,794 | 10.9% |
| Feed and Industrial Products | ||||||||||
| Tropical Oils | 5,964 | 5,875 | 5,776 | 5,193 | 5,909 | 0.9% | 1.5% | 22,808 | 22,226 | 2.6% |
| Oilseeds and Grains | 6,133 | 4,992 | 4,932 | 4,142 | 5,580 | 9.9% | 22.9% | 20,199 | 22,071 | -8.5% |
| Sugar | 3,140 | 2,714 | 3,700 | 2,433 | 3,795 | -17.3% | 15.7% | 11,987 | 13,787 | -13.1% |
Source : Company, DBS Bank
Segmental Profit Before Taxes (PBT)
| Segmental PBT (US$m) | 2H2022 | 1H2021 | 2H2020 | 1H2020 | 2H2019 | FY2021 | FY2020 | y-o-y | 2H21/2H20 | FY2019 |
| Food product | 252.6 | 428.3 | 657.4 | 495.1 | 566.3 | 681 | 1,152 | -41% | -62% | 975 |
| Feed and industrial product | 782.2 | 478.8 | 425.1 | 370.8 | 449.3 | 1,261 | 796 | 58% | 84% | 630 |
| Plantation and sugar milling | 400.1 | 164 | 187.8 | (82.9) | 62.2 | 564 | 105 | 438% | 113% | (41) |
| Others | 38.5 | 8.7 | 100.7 | (41.2) | (8.1) | 47 | 59 | -20% | -62% | (8) |
| Joint Ventures & Associates | 80.3 | 139.2 | 118.1 | 84.1 | 110.2 | 220 | 202 | 9% | -32% | 153 |
| Unllocated expenses | -3.3 | -3.5 | (2.5) | (0.9) | (1.5) | (7) | (3) | 100% | 32% | (11) |
| Profit before taxes | 1,550 | 1,216 | 1,487 | 825 | 1,178 | 2,766 | 2,311 | 20% | 4% | 1,699 |
Source : Company, DBS Bank