<Result Analysis> Benefitting from the strong vegetable oil prices
- 1Q22 core net profit in line with our forecast
- Tropical oil business drove earnings performance in the quarter
- Preferred for its earnings record and leading food processor in Asia
- Maintain BUY with TP of S$6.67
What’s new
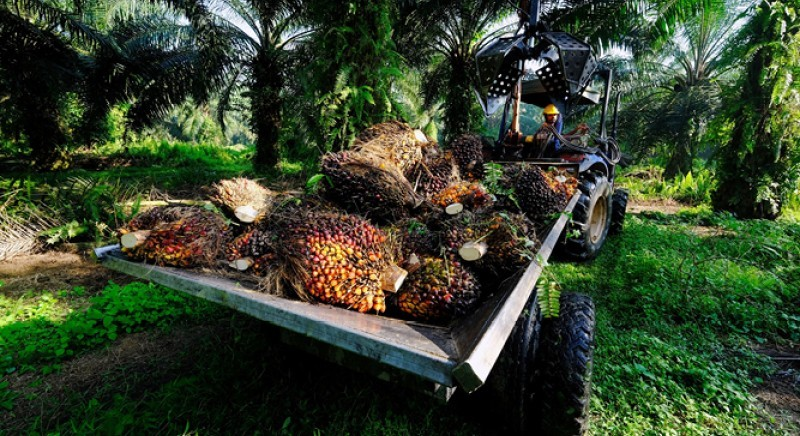
- 1Q22 core net profit reached US$503m (+18.8% y-o-y, -5.7% q-o-q) in line with our and consensus forecast. 1Q22 earnings formed 27% of our FY22 earnings forecast of US$1.89bn (+2.3% y-o-y). The positive earnings growth y-o-y was driven by the plantation and sugar milling division mainly on strong palm oil prices.
- Exceptional gain on dilution of interest in Adani Wilmar supported Food Products segment performance.
- The gain amounted to US$175.6m which supported food product segment performance on top of the operational profits, albeit margins were impacted by rising commodity prices.
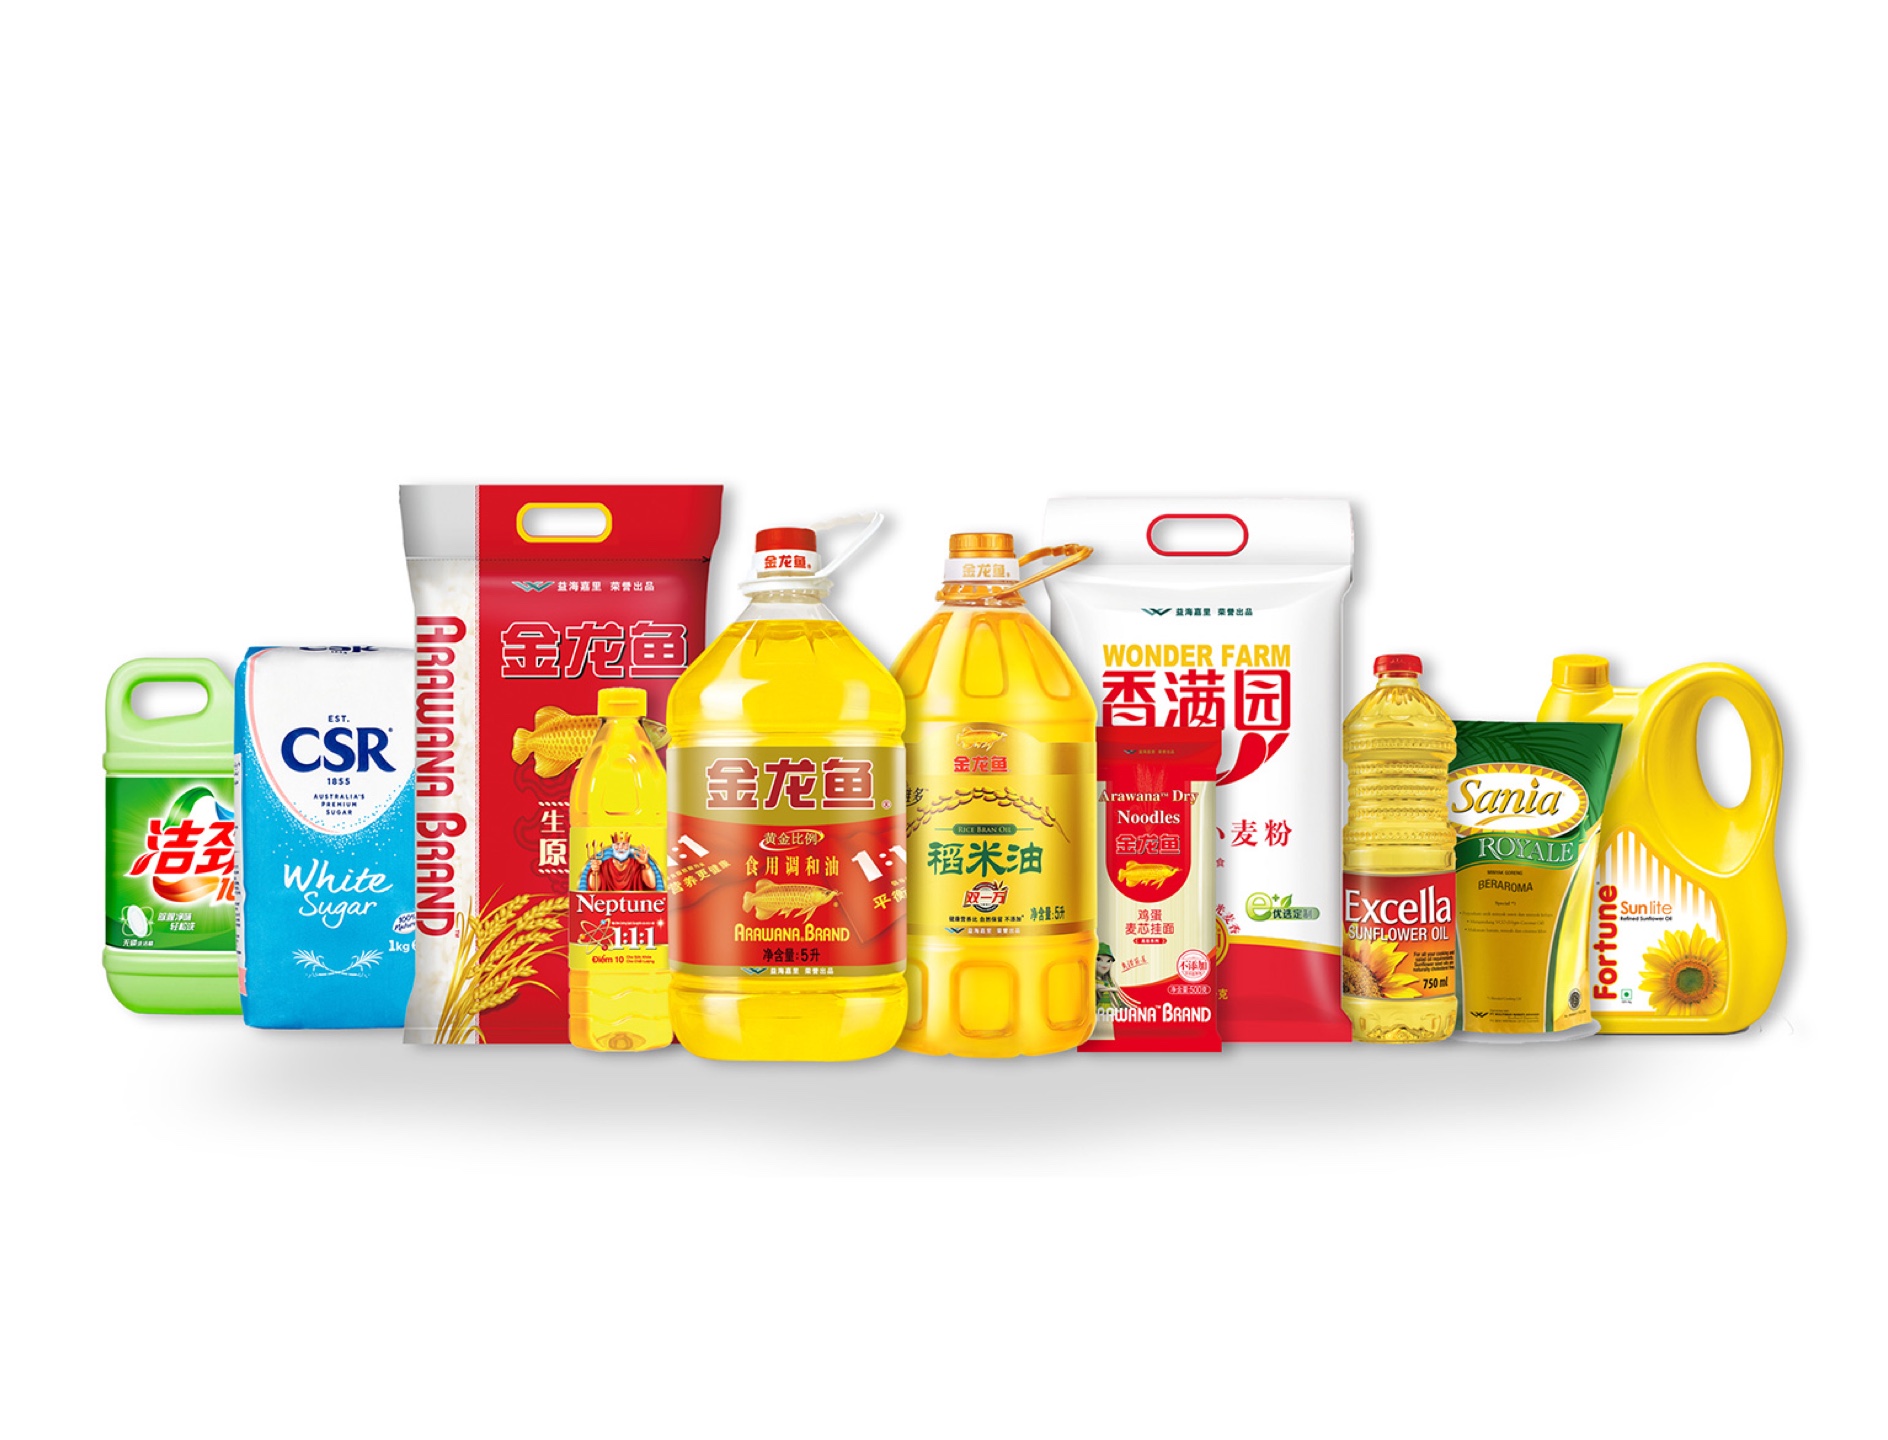
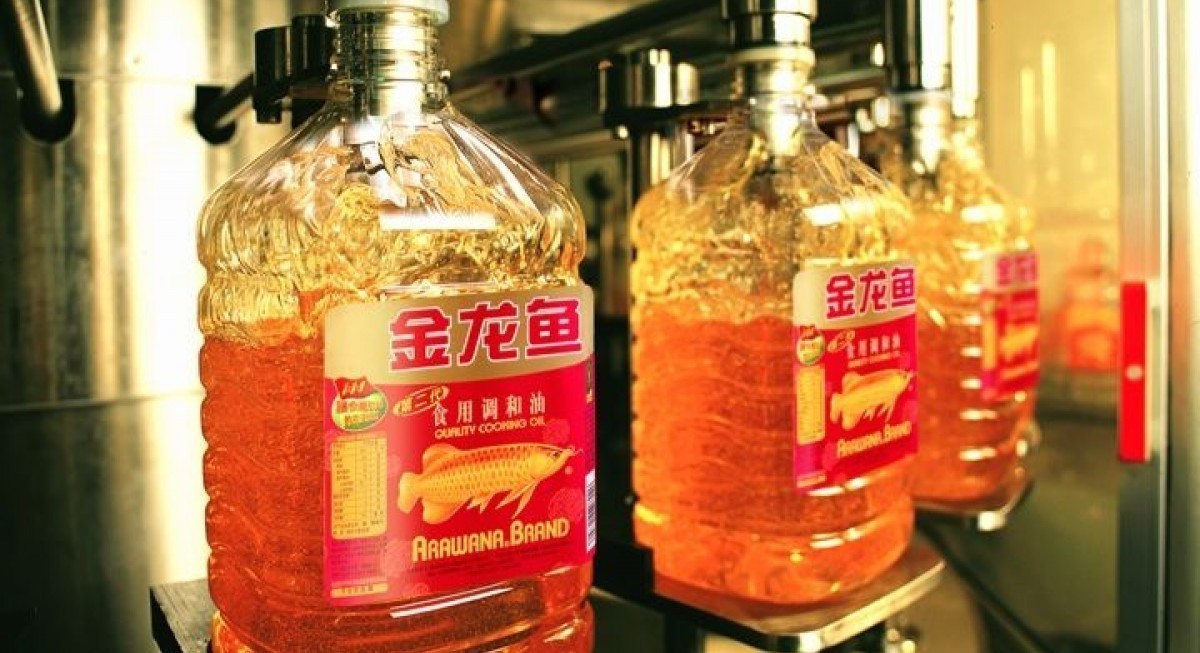
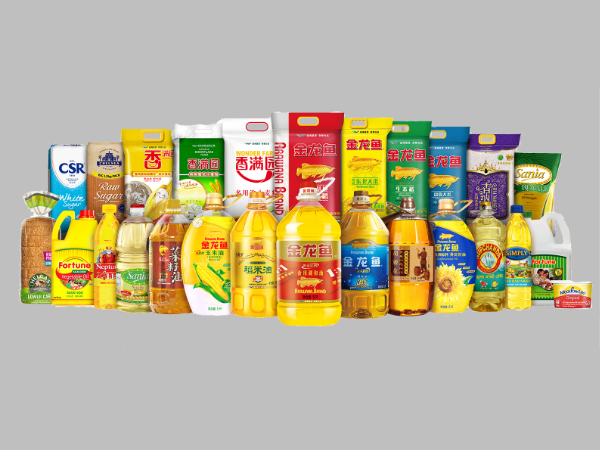
- Sales volume of medium pack and bulk Food Products increased by 1.8% y-o-y to 4.6 MT ( -13.3% q-o-q) driven by Wilmar flour milling plants capacity expansion. Meanwhile sales volume of consumer products decreased by 6.2% y-o-y to 2.3m MT (+5.7% q-o-q). Consumer pack oil in China was affected by recent COVID-19 outbreak and economy slowdown.
- Feed and Industrial products segment still dragged by weak crushing margin in China.
- Sharp increase in soybean price, coupled with weaker soymeal demand due to poor poultry and pig farming profitability were the key reasons for the weaker soybean crushing margin trend.
- Overall sales volume for Feed and Industrial Products increased by 0.9% y-o-y to 11.9m MT (-22.1% q-o-q) as result of higher sugar merchandizing activities, despite being partially dragged down by weaker demand of downstream tropical oil during the quarter.
- Cashflow and balance sheet. Operating cash flow before working capital changes reached US$654.3m (1Q21 : US$1.05bn) however, rising commodities price resulted in higher working capital requirements , leading to overall operating cash outflow of US$496.1m 1Q22 vs. cash inflow of US$96m in 1Q21. Furthermore, net debt increased by US$1.23bn to US$18.47bn resulted higher gearing ratio of 0.91x vs. FY21 : 0.87x. Wilmar’s unutilized credit facilities remained at US$25.85bn in 1Q22 , similar to the previous quarter.
Our view
- Tropical oil division will continue to drive Wilmar earnings in 2022. Strong vegetable oils price trend will be the key earnings driver in 2022, while recovering soybean crushing margin on improving soymeal demand will provide another earnings growth catalyst in 2H22. We maintain our FY22 earnings forecast of US$1.89bn (+2.3% y-o-y) for now.
- Maintain BUY with TP of S$6.67. Wilmar is trading at around 11x FY22F PE, which is the level that Wilmar has been trading in the last five years. However, considering Wilmar’s earnings track record and its position as one of the leading tropical oil refiners and food processors in Asia, as well as its expansion to branded consumer goods and central kitchens, we believe Wilmar deserves a higher valuation multiple.
Quarterly financial summary
| 1Q22 | 4Q21 | 3Q21 | 2Q2021 | 1Q2021 | y-o-y | q-o-q | |
| US$m | US$m | US$m | US$m | US$m | change | Change | |
| Revenue | 17,576 | 19,125 | 17,135 | 15,271 | 14,263 | 23.2% | -8.1% |
| EBITDA | 1,108 | 1,148 | 1,140 | 797 | 1,087 | 1.9% | -3.5% |
| Net Profit | 530 | 570 | 569 | 301 | 450 | 17.8% | -7.0% |
| Core Net Profit | 503 | 534 | 576 | 308 | 424 | 18.8% | -5.7% |
| EBITDA | 6.3% | 6.0% | 6.7% | 5.2% | 7.6% | ||
| Net Profit | 3.0% | 3.0% | 3.3% | 2.0% | 3.2% | ||
| Core Net Profit | 2.9% | 2.8% | 3.4% | 2.0% | 3.0% | ||
| Sales Statistics (‘000MT) | |||||||
| Food Products | |||||||
| Consumer Products | 2,330 | 2,205 | 2,231 | 1,618 | 2,485 | -6.2% | 5.7% |
| Medium Pack and Bulk | 4,575 | 5,276 | 5,237 | 4,719 | 4,494 | 1.8% | -13.3% |
| Feed and Industrial Products | |||||||
| Tropical Oils | 5,058 | 5,964 | 5,875 | 5,776 | 5,193 | -2.6% | -15.2% |
| Oilseeds and Grains | 4,098 | 6,133 | 4,992 | 4,932 | 4,142 | -1.1% | -33.2% |
| Sugar | 2,718 | 3,140 | 2,714 | 3,700 | 2,433 | 11.7% | -13.4% |
| Operating cashflow before working capital changes | 654 | 1,203 | 985 | 750 | 1,056 | ||
| Cashflow from operating activiities | (496) | (4,710) | 2,064 | (1,489) | 96 | ||
| Net Debt | 18,471 | 17,238 | 15,698 | 16,886 | 17,238 | ||
| Equity attributable to owners of the Company | 20,303 | 19,924 | 19,265 | 19,013 | 19,924 |
Source : Company, DBS Bank